Monit / Healing
WPCloudDeploy gives you the option of installing a pro-active monitoring service call MONIT. It is a lightweight service that can be configured to send you email alerts when certain thresholds on your server have been exceeded. MONIT also has a premium option called M/Monit that allows for a central dashboard that consolidates information from all your servers as well as well as allow you to use your mobile devices to monitor your servers on-the-go. If you have a subscription, you can connect your server to it.
Note: Monit & Monitorx are two different services used for different things.
Installing MONIT On A Server
- Recommended: Make sure all security updates have been applied and restart the server. (No need to install non-security updates.)
- Navigate to WPCloudDeploy → All Cloud Servers and click on one of your servers
- Click on the Healing tab.
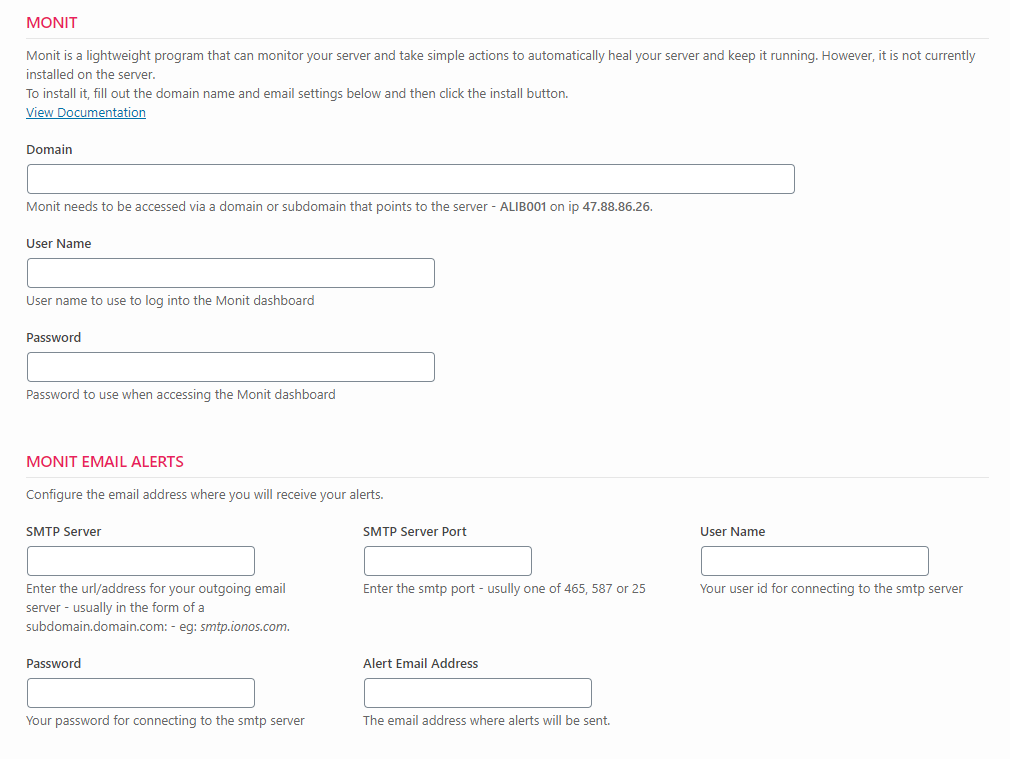
- There are three sections that need to be filled out in order to activate Monit. Only two are mandatory.
- The first section requires that you provide a domain through which you’ll access the servers’ dashboard. Generally this is just a subdomain of a domain you already control. It also requires that you provide a user id and password to protect access to the Monit dashboard. (The user name and password must consist of only ALPHANUMERICS. Otherwise MONIT will fail to start with a silent error.)
- The second section requires that you set up a connection to your EMAIL server so that alert emails can be sent.
- The third section is optional – if you have subscribed to the premium M/Monit service you can connect your server to it by entering your private URL to the services’ dashboard.
- After filling out the data in the three sections, click the INSTALL MONIT button. It shouldn’t take too long for the installation to complete – maybe a couple of minutes.
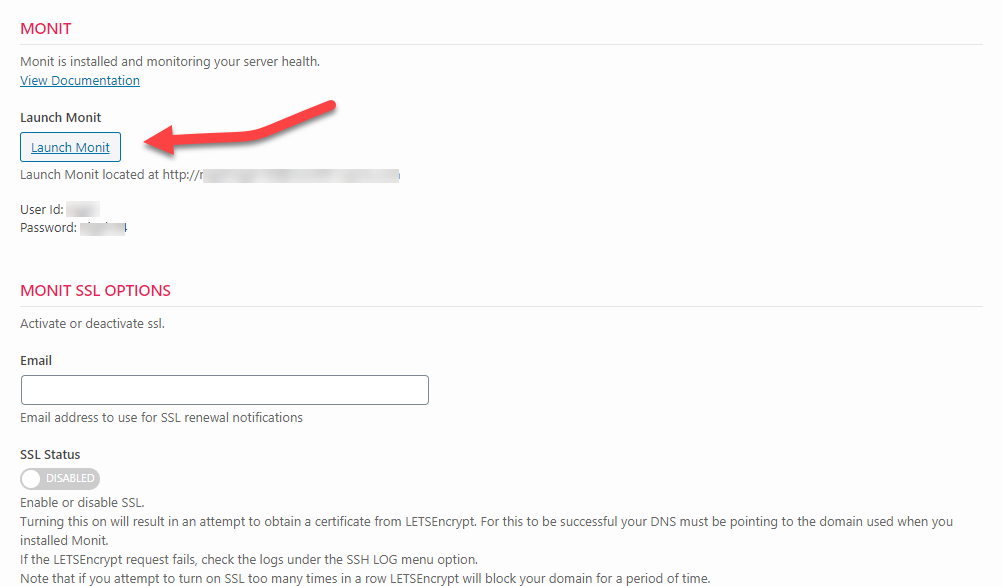
After installation is complete you will see a new set of options in that tab. And, if your email configuration is correct, you should receive your first couple of email alerts indicating that the Monit service is up and running.
Activating SSL
Since the data you are transmitting can be sensitive we encourage you to activate SSL. Assuming that you’ve already pointed your DNS to the servers’ ip, you can just click the SSL Status button on the HEALING tab and an SSL certificate will be requested for you.
Launching The Monit Dashboard
To view the MONIT dashboard all you need to do is click the LAUNCH MONIT button.
How To Use Your Monit Dashboard
Your MONIT dashboard should look something like this:
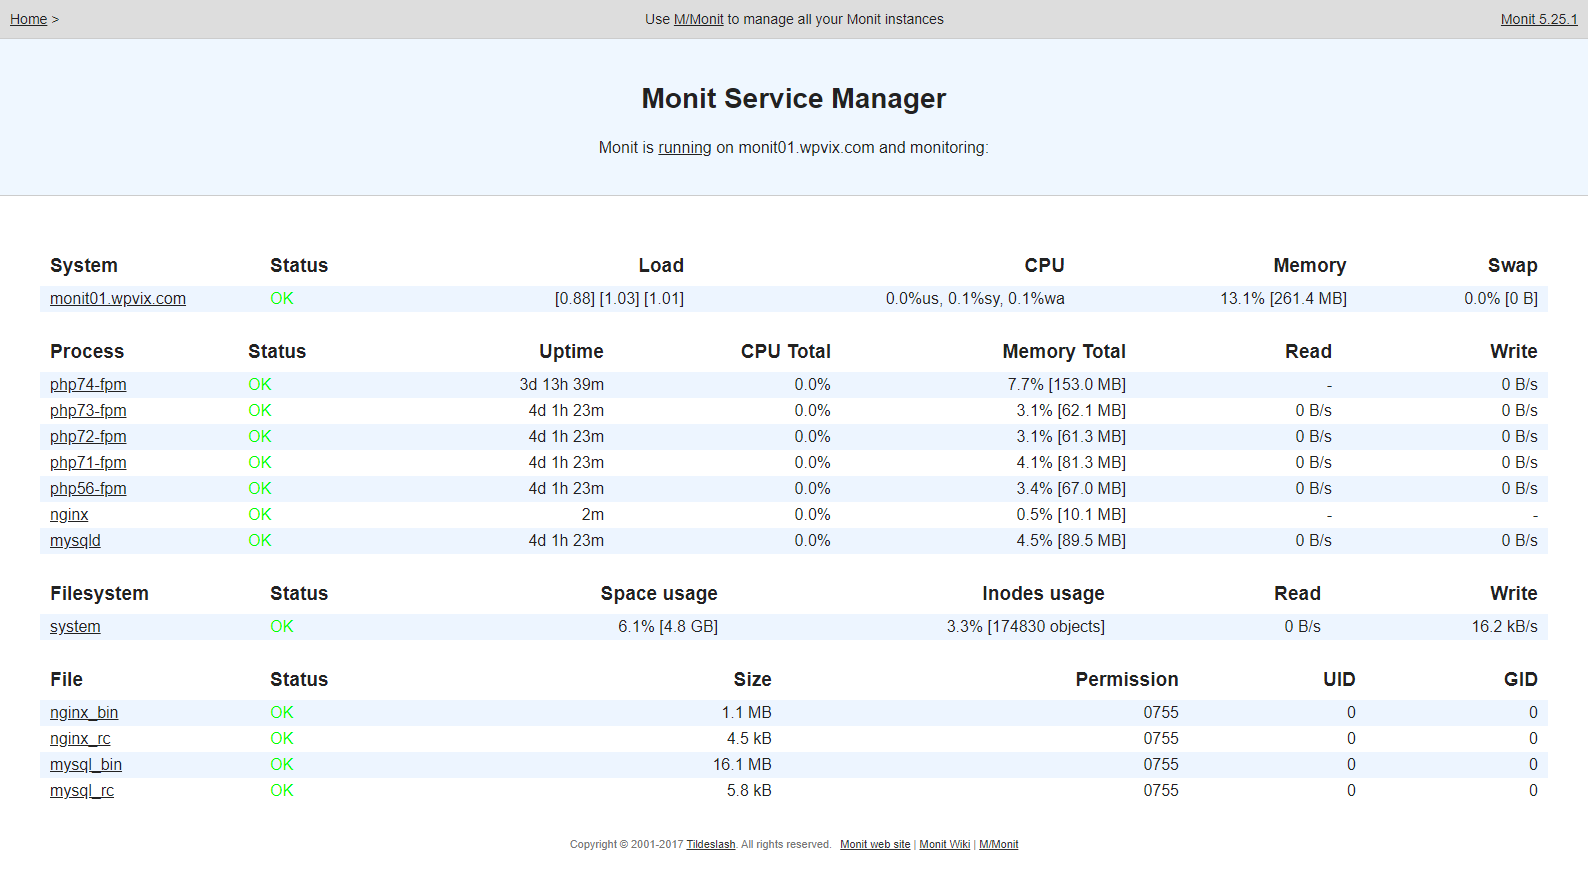
You can click on an individual item in the first column to drill down into it. In particular, when you click on an individual item you will be able to see exactly what levels are being monitored and what actions will be triggered at those levels.
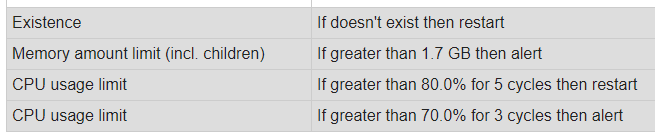
What We Monitor
When MONIT is installed, we set it up with some simple default monitors. The thresholds are set dynamically based on the size of your server.
We have set it up so that a “cycle” is 2 minutes. I.e.: It will check the services every 2 minutes.
NGINIX (Web Server)
- If it uses greater than 70% of the CPU for 4 minutes (2 cycles) an alert will be sent
- If it uses greater than 80% of the CPU for 10 minutes (5 cycles) it will be restarted
MariaDB (Database Server)
- If it uses greater than 70% of the CPU for 4 minutes (2 cycles) an alert will be sent
- If it uses greater than 80% of the CPU for 10 minutes (5 cycles) it will be restarted
- If it uses greater than 85% of memory for 6 minutes (3 cycles) it will be restarted
PHP
- If it uses greater than 70% of the CPU for 6 minutes (3 cycles) an alert will be sent
- If it uses greater than 80% of the CPU for 10 minutes (5 cycles) it will be restarted
- If it uses greater than 85% of memory send an alert
File System
Monitoring only “/”
- If diskspace being used is greater than 80% an alert will be sent
System
- If memory used is greater than 85% for 6 minutes (3 cycles) an alert will be sent
- If CPU usage is greater than 70% for 4 minutes (2 cycles) an alert will be sent
Note: CPU usage in MONIT can exceed 100% – each processor is “100%” so on a dual processor system CPU usage can be 200%. We dynamically scale CPU thresholds based on the number of CPUs detected when MONIT is installed. So, on a 2 processor system we will set the CPU alert level to 140% instead of 70%.
How To Change The Monit Thresholds
You can only customize what MONIT is monitoring by directly editing its configuration files on the server.
Learn more about MONIT and how to configure it in the Monit Documentation.
There are some real-world examples of configurations for popular services on the M/Monit site as well.
All Monit configuration files are located in the following locations:
- /etc/monit/monitrc – this is the overall configuration file
- /etc/monit/conf-available – this folder holds configurations for individual items such as Nginx, MySQL etc.
Why Is The Tab Called HEALING
We called the tab on the server page “healing” because Monit will automatically restart degraded services. – i.e.: it will attempt to heal a service. This option is set by default for MariaDB, NGINX and PHP.
Notes
- If you resize your server up or down, the default MONIT settings are likely to be inadequate. So, either edit the MONIT configuration files directly to adjust or uninstall and reinstall MONIT to get new defaults.
- Installing MONIT might result in a poorer end user experience if your server is constantly running at full throttle. This is because MONIT is configured to restart services if thresholds are exceeded for a certain length of time. That, in turn, will cause existing user connections to drop and new connections to be refused during the services’ restart period. If you need your server to be running at full throttle all the time you should remove MONIT or edit the configuration files to use higher thresholds for alerts and automatic restarts.
- The MONIT configuration file is very sensitive to the format of the configuration data provided. We STRONGLY recommend that you only use alphanumerics for most fields (username, password, the first part of email addresses etc.) Otherwise, MONIT will fail to start with a silent syntax error.
- If MONIT consistently fails to install, look in the SSH LOGS screen to find the installation record. Inspect it to make sure there are no LOCK file messages or JOURNAL messages. If there are, you might need to restart the server, wait for background updates to be installed or take other mitigating actions before the server is ready for MONIT.
Availability
The Monit feature first became available in WPCloudDeploy version 4.2.5.
More Topics In Admin
- Restoring From AWS S3 Into A New Site or Server
- Backups With AWS S3
- Restoring From Backup
- 6G Firewall (Deprecated)
- 7G Firewall
- Native Linux Cron
- Disabling Sites
- Password Protect A Site (HTTP Authentication)
- One-click Login (AKA Passwordless Logins)
- Remove/Delete Site
- Manage PHP Options
- Add A WordPress Administrator
- Notifications and Alerts
- Managing WordPress DEBUG Flags
- Object Cache: MemCached
- Object Cache: Redis
- DNS Integration: CloudFlare
- Site Packages
- Site Update Plans
- Site Expiration
- White Label Colors
- Adding Custom NGINX Configs
- Custom Servers (Bring Your Own Server)
- How To Change The IP Address For Your Server
- Virtual Cloud Providers
- Monitorix
- File Manager
- PHPMyAdmin - Database Operations
- Using Remote Databases
- SMTP Gateway
- Server Updates
- Theme & Plugin Updates
- Bulk Actions on Servers
- Bulk Actions on Sites
- SSH Key Overrides
- Webserver Types
- WPCD Cron Jobs
- Disk Quotas
- Custom Post Type Quotas
- Using Post-Processing Custom Bash Scripts
- Bulk Copy To Server
- Copy To Server (Automated Daily Process)
- Shortcodes
- Bootstrapping A WordPress Server With Our Scripts
- Bootstrapping A WordPress Server With Our Scripts - Archive Version 4.x
- Free Setup Requirements & Checklist
