The release of V4.2.6 of WPCloudDeploy included some performance related updates and so it’s time for us to take a new look at our performance benchmarks.
As you might expect, there are multiple items that affect performance, some of which WPCD can control and some of which we can do nothing about.
Some of these items are:
- Machine specifications (CPU speed and memory)
- How the website is constructed (lots of plugins? lots of blocking JS code? lots of poorly optimized php code?)
- Speed of the network connection
- Caching (what type is it, is it on or off?)
- Web server tuning aka “the server stack”
The only aspects on the above list that WPCD has any real control over are the last two items – especially the last one.
So, all else being equal, we need to measure performance to make sure that we’re being efficient with the use of server resources. We’re not trying to wring every last ounce of performance we can out of our stack – given a choice we would still err on the side of site stability.
How We Test
As with most of our performance testing, we use a real-world website. This site has the following characteristics:
- 56 active plugins and 21 inactive plugins (you’d be surprised at how many sites have more than 2 dozen active plugins so testing with a lot of plugins active is far more realistic than just using the WP starter site.)
- A pagebuilder theme (Beaver Builder)
- Object Cache: Redis
- Page Cache: Nginx (WPCD default)
- 5 PHP Workers (WPCD default)
- 128 MB max memory per PHP worker (WPCD default)
- More than 1 GB of data in the database scattered between WP Core tables and custom tables.
Included in the 56 active plugins were the following:
- Easy Digital Downloads
- Formidable Forms
- Beaver Builder
- Metabox
- Updraft Plus
- Relevansi
- Shortcodes Ultimate
- All-in-on SEO
Our Server
We ran most of our tests on a Linode server with 2 dedicated cpu cores and 4 GB of RAM that cost approximately 30 dollars (USD) per month.
There are a couple of tests where we resized the server to make a point but we’ll mention the difference when we display those metrics.
Types of Tests
We conducted four types of tests:
- Cached Pages
- Uncached Pages
- Mix of Cached and Uncached Pages
- Other (comparative testing or interesting benchmarks)
Reading The Performance Charts
The charts from our performance vendor (k6.io) show the most important metrics at the very top. The chart lines themselves can be interpreted as follows:
- Gray: Number of virtual nusers
- Purple: Number of requests / second
- Blue: Response time for each page request
Cached Pages
We started off our tests with 50 virtual users and made sure that 100% of our requests went to cached pages. This became our baseline performance – it is the best case scenario for a complex WordPress site.

As you might expect, it’s extremely fast with sub-second response times of 32 MILLISECONDS(!) and a ridiculously high throughput rate that really taxed the capacity of the servers’ network adapter.
For brochure and informational sites with no e-commerce activity, this is the performance profile you’re likely going to experience.
Even when we doubled the number of users the average response time didn’t vary that much.
UnCached Pages
Then we took a look at the complete opposite scenario – this is the ultimate stress test for a WordPress server. In the real-world it is highly unlikely that 100% of the traffic on a site will bypass the cache. But, it is a great way to test the absolute limits of a server.
Given the complexity of our test site and with all of the traffic bypassing the cache, we fully expected that the server would only be able to handle a few simultaneous users before response time increased dramatically. And that’s exactly what we saw.
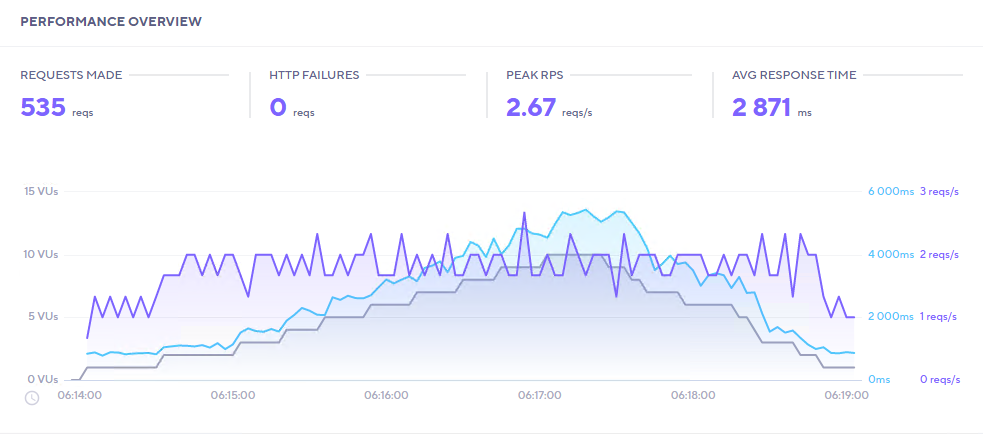
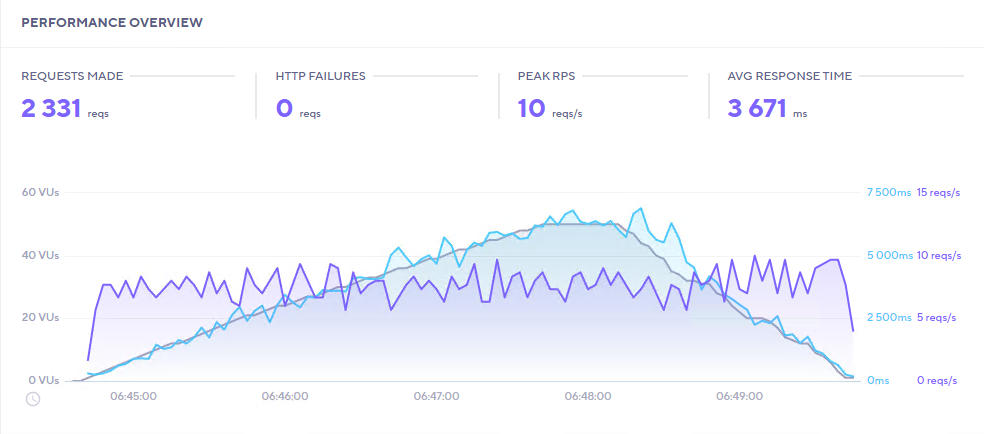
10 Virtual Users
With 10 virtual users, we saw the average response time start out below one second and end up slightly below three seconds when all 10 users were requesting uncached pages at the same time.
This is actually not so bad because portions of code from all 56 plugins plus the site theme had to be compiled for every request. A faster CPU as well as additional cores would definitely make a difference on these kinds of uncached requests.
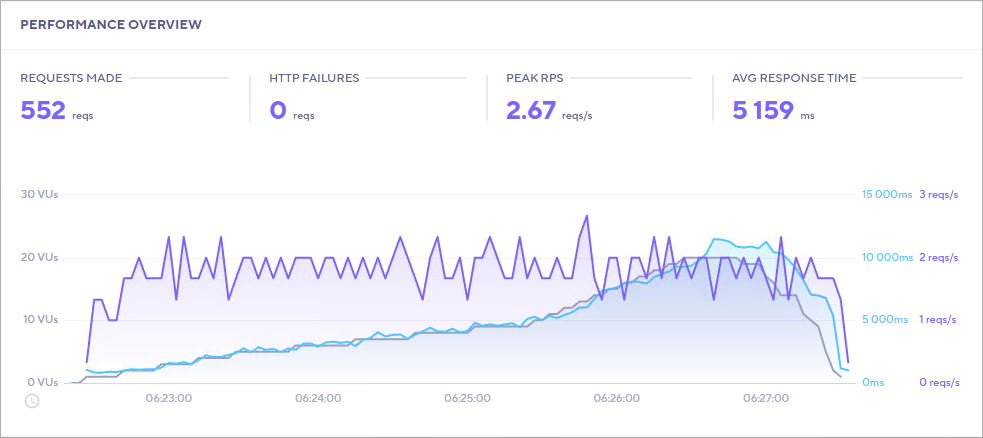
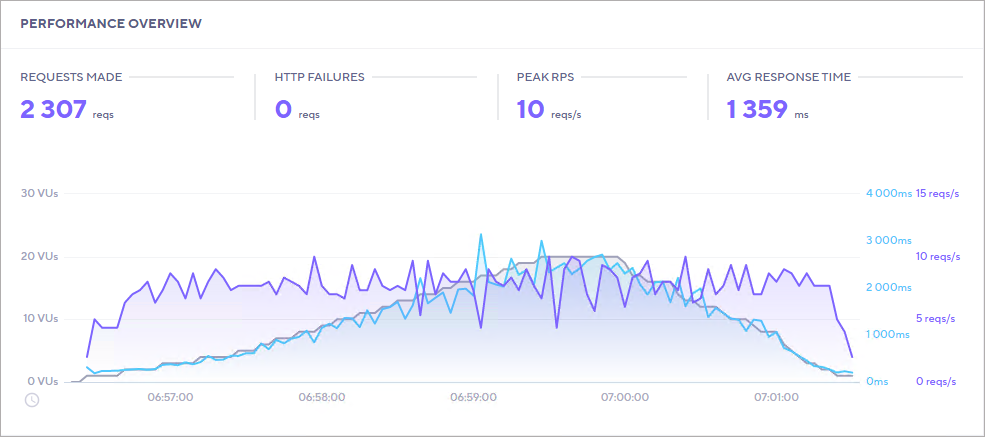
20 Virtual Users
With 20 virtual users, the average response time jumped to just below 6 seconds with no change in the number of requests per second that the server could handle.
50 Virtual Servers
Finally we ran the tests with 50 virtual users – we wanted to see if the server would drop any traffic or simply take a longer time to process the requests.
As it turned out, no requests were dropped but the response time quickly jumped from a couple of seconds to above 15 seconds. Still, it eventually handled 100% of the requests that was thrown at it.
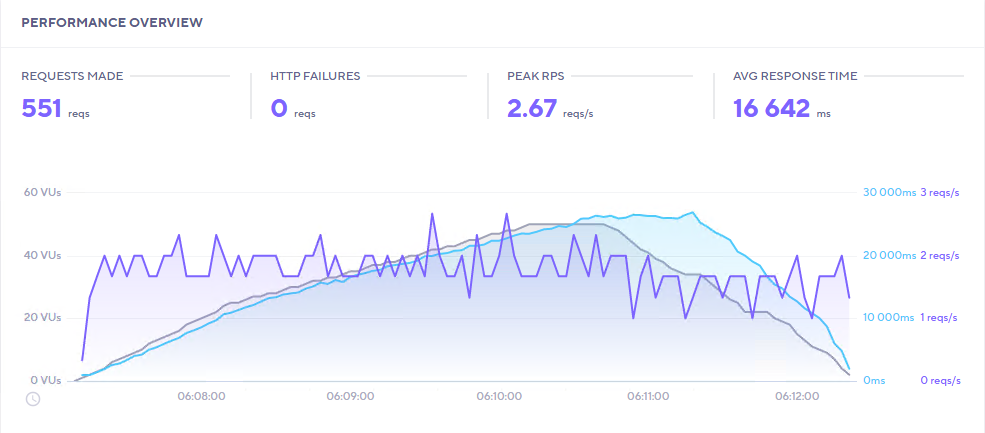
In all of the tests, the peak throughput was only a little less than 3 requests per second. Which makes sense – with two CPUs, you probably can’t get much beyond 2 requests per second when compiling code from 50+ plugins for every single page request!
Increasing Cores
To prove to ourselves that the site was CPU bound, we increased the number of cores on our test machine to 4 and re-ran the tests with 50 virtual users.

If you compare the above chart to the one just before it you’ll notice that the number of requests we were able to make almost doubled and the average response time dropped by 44%. And the peak number of requests per second is four – exactly the number of cores on the server!
Basically, doubling the cores almost doubles performance.
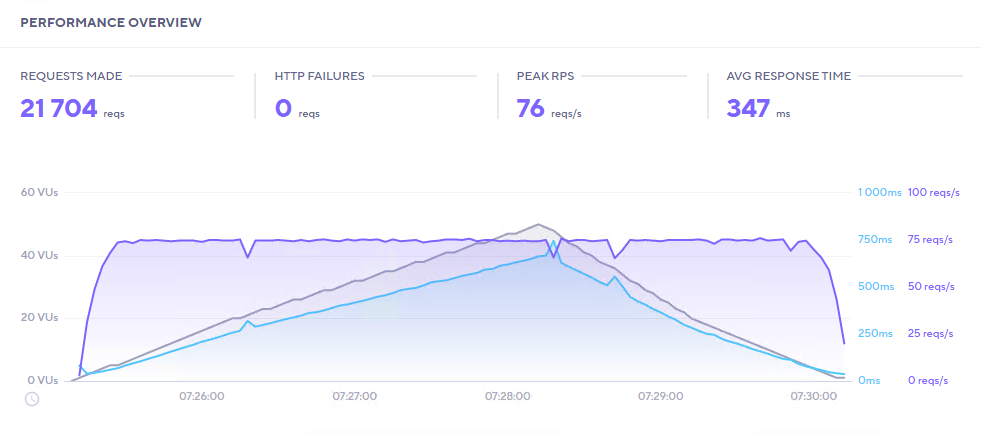
Max Cores
So, if the increase to four cores doubled performance, why not go for broke and see how things play out? With that thought in mind, we increased the number of cores to sixteen, increased the number of PHP WORKERS to sixteen (otherwise you wouldn’t be able to use all the cores) and re-ran the tests again.
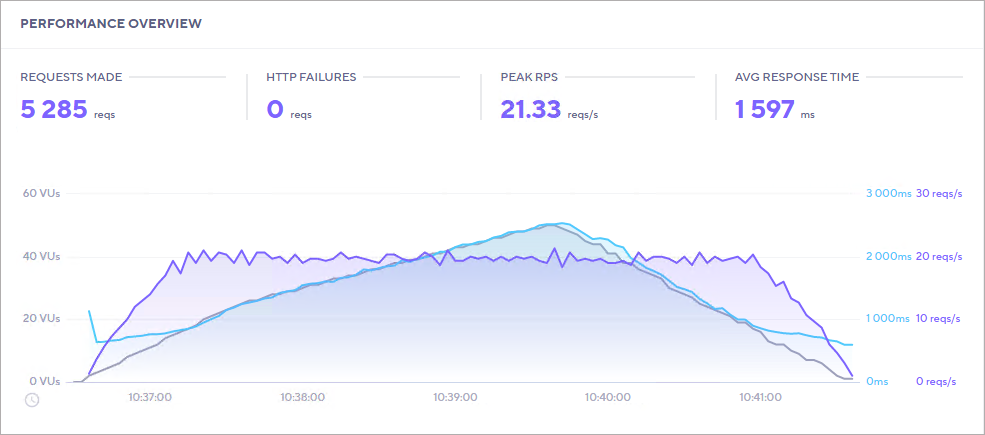
And there you go – the increase in the cores dramatically improved performance across the board. With a dedicated core for each uncached request available most of the time, performance and throughput went through the roof relative to where we started.
Mixed Caches
Our final test suite consisted of a mix of cached and uncached requests. 10% of the requests were uncached while the remainder were cached. This is closer to what a real-world e-commerce site might experience.
We ran this test with 50 virtual users with the following results:
Compared to 100% of requests being uncached with 50 simultaneous users, this is certainly a lot better.
But, given the sheer size of the code that needs to be compiled for every uncached request, we wanted to try to match the uncached requests to the number of CPUs. So, we dropped the number of simultaneous users down to 20 – with 10% of the requests being uncached. That works out to be, on average, two uncached requests at any given time – or about 1 per available CPU.
Yup, that was definitely better. When you have a large code-base that needs to be re-compiled on the fly, I don’t think you’ll be getting too much better than 1 -2 seconds per request per available CPU. In this kind of a situation you’d need to add 1 additional CPU for every 10 simultaneous users you expect on the WP site.
Comparison: WP Starter Site, Uncached
The WP Starter Site installed with every new WP install is an unrealistic site to use for stress testing. Yet, many companies use it to attempt to show-off how “fast” their tech stack can be.
So let’s do the same with WPCD.
We’ll start off by using an UNCACHED WP Starter Site with 50 simultaneous virtual users.
You get sub-second response times – because there is barely any code that needs to be compiled, or JS that needs to be enqueued.
And, of course, for cached requests you get the following – an average response time of 21 MILLISECONDS.
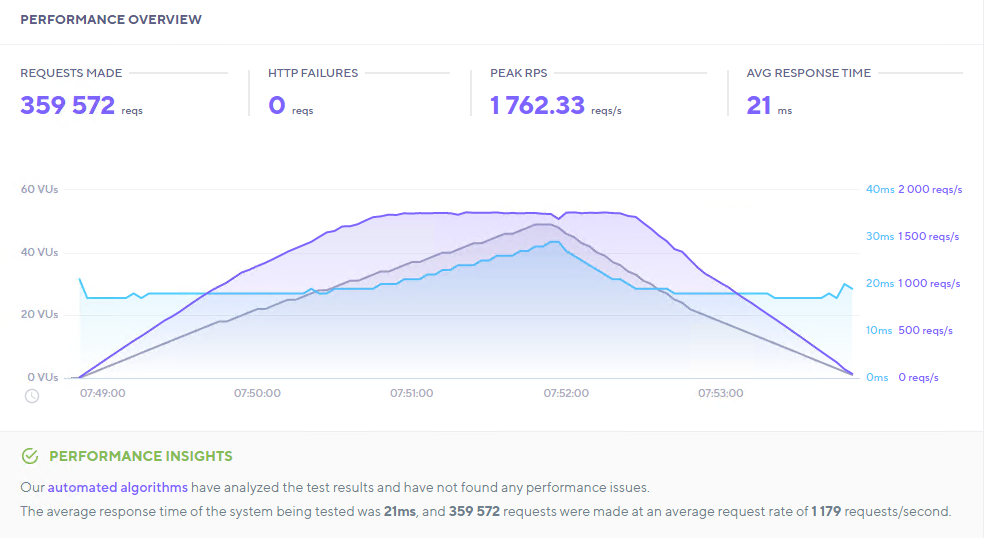
Note that the average response time for cached pages for this tiny site isn’t that much better than when serving a cached page on a very large site (see our first section). This is because the time it takes to serve a cached page is no longer dependent on the speed and availability of the CPU – it primarily depends on the size of the cached page and the number of outstanding requests in the Nginx pipeline (all else being equal).
Wrapup & Conclusions
As you probably already know (and can see from the above numbers), caches play a huge role in keeping WordPress responsive.
And, with large codebases, you do need to try to match the uncached requests to an available CPU – since you need CPU resources to compile code on the fly.
The conclusions you can draw from these numbers are probably extremely obvious if you’ve spent a few years in the WordPress world:
- Cached pages are very very good so try to make sure your site can cache as many pages and posts as possible.
- When processing uncached pages, the faster your CPUs the better (duh!)
- You need to match the average number of uncached requests to the number of available CPUs and the average time it takes to compile a page. (With our example of a very large site, it takes more than 1 second to compile the code for a page. A smaller site might take half a second, so, with 2 cores, it might be able to handle 3-4 uncached requests every second.)
Ultimately, it doesn’t really matter that much how “optimized” your stack is – the gating factor for uncached pages will be CPU. Either you have enough CPU resources or you don’t. You can fiddle with many things to better handle a lot of traffic but ultimately your CPU resources (or lack of it) is likely to be the thing that makes or breaks the average site.
So, when your WordPress professional wants to take the time to write custom code to reduce the amount of plugins and themes that are used, or to try to spend a day or two optimizing your site’s code, maybe consider allowing them to do just that. Because those are the things that will ultimately help the site make more efficient use of available CPU cores.
Also, if your developers tell you that you need more CPU cores or faster CPUs, it’s probably because uncached requests are piling up and the existing CPUs can’t process them fast enough.
Finally, there are things a developer can do to help the browser be more efficient – such as combining CSS and JS files, reducing blocking JS scripts, not using inefficient scripts (such as those used for tracking) and so on. But those items will have nothing to do with the WPCD server stack.
Was This Article Useful? Or do you have questions or comments about it (or our products & services)? We'd love to hear from you!
Automatic Notification Of New Articles
Sign up to get automatic notifications of new articles. This is a different list than our standard list - you only get new articles once a week (usually on Mondays). No other emails will be sent unless you sign up for our general list as well.
Follow us on Twitter! We post a lot of cool things there first. To keep up, click the "X" below!